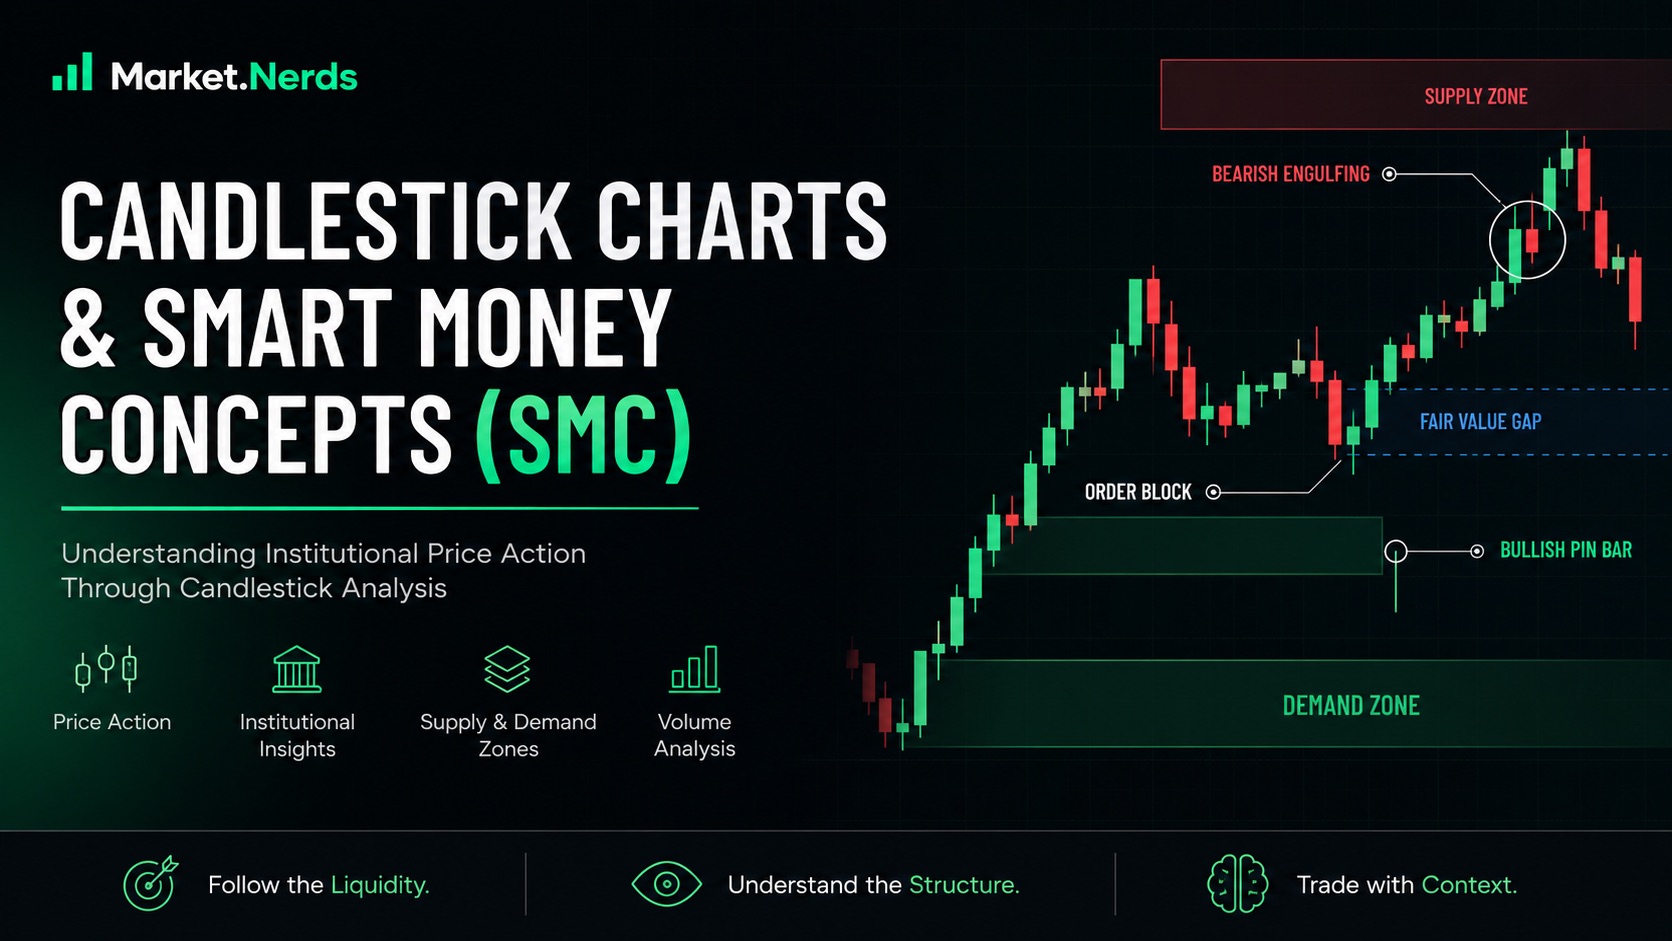
Candlestick Charts and Smart Money Concepts (SMC)
Understanding Institutional Price Action Through Candlestick Analysis
Introduction
Candlestick charts are among the most widely used tools in technical analysis, providing traders and investors with valuable insight into market sentiment, price behavior, and potential future direction. When combined with Smart Money Concepts (SMC), candlestick analysis becomes a powerful framework for understanding how institutional participants may influence market structure.
Rather than viewing candles as isolated formations, SMC encourages traders to interpret price action within the broader context of liquidity, market structure, supply and demand dynamics, and order flow. This approach allows traders to move beyond traditional pattern recognition and develop a deeper understanding of market behavior.
1. Candlestick Chart Fundamentals
What is a Candlestick?
A candlestick represents the price movement of an asset during a specific period of time. Each candle contains four essential data points:
Open Price – The first traded price during the period.
High Price – The highest price reached during the period.
Low Price – The lowest price reached during the period.
Close Price – The final traded price during the period.
Together, these four components provide a visual summary of market activity and participant sentiment.
Bullish vs. Bearish Candles
Bullish Candle
Closing price is higher than the opening price.
Indicates buying pressure dominated during the period.
Bearish Candle
Closing price is lower than the opening price.
Indicates selling pressure dominated during the period.
Understanding Candle Structure
The Real Body
The body represents the difference between the opening and closing prices.
Large bodies often indicate strong momentum and conviction.
Small bodies suggest market indecision or equilibrium between buyers and sellers.
The Wicks (Shadows)
The upper and lower wicks represent the highest and lowest prices reached during the trading period.
Long wicks can indicate price rejection, liquidity grabs, or failed attempts to continue in a particular direction. Within the SMC framework, these areas often become important reference points for future market reactions.
2. Key Candlestick Patterns in Smart Money Trading
While individual candles provide useful information, institutional activity is often reflected through sequences of candles and broader price structures.
Engulfing Candles
An engulfing pattern occurs when a larger candle completely encompasses the body of the previous candle.
Interpretation
Demonstrates a significant shift in market sentiment.
Often signals momentum entering the market.
Can support a continuation or reversal narrative depending on market context.
SMC Perspective
When an engulfing candle forms near a key supply or demand zone, it may indicate institutional participation and a potential shift in order flow.
Inside Bars
An inside bar forms when a candle's entire range remains within the range of the previous candle.
Interpretation
Represents temporary consolidation.
Reflects a balance between buyers and sellers.
Often precedes periods of increased volatility.
SMC Perspective
Inside bars frequently develop before liquidity events and breakout movements. Traders monitor these structures for clues regarding future directional intent.
Pin Bars and Rejection Candles
A pin bar features a small body and a prominent wick.
Interpretation
Indicates strong rejection of a price level.
Suggests one side of the market attempted control but failed.
SMC Perspective
Pin bars occurring at key liquidity levels, order blocks, or supply and demand zones can provide valuable confirmation for trade setups.
High-Volume Candles
Large candles accompanied by elevated trading volume often signal increased market participation.
Interpretation
Strong buying or selling interest.
Potential institutional involvement.
Confirmation of breakout or trend continuation scenarios.
SMC Perspective
Volume should be used as a supporting factor rather than a standalone signal. Significant price movements accompanied by above-average volume often carry greater credibility.
3. Supply and Demand Zones
Supply and demand zones represent areas where significant buying or selling activity has previously occurred.
Supply Zones
Supply zones are areas where selling pressure previously overwhelmed buying pressure.
Characteristics include:
Strong bearish momentum away from the zone.
Large bearish candles.
Multiple failed attempts to trade above the area.
These zones often act as potential resistance levels when revisited.
Demand Zones
Demand zones are areas where buying pressure previously exceeded selling pressure.
Characteristics include:
Strong bullish momentum away from the zone.
Large bullish candles.
Repeated support reactions.
These zones often act as potential support levels when revisited.
4. Order Blocks and Fair Value Gaps (FVGs)
Order blocks and Fair Value Gaps are foundational concepts within Smart Money Concepts.
Order Blocks
An order block is generally defined as the final opposing candle before a significant directional move.
Why They Matter
Order blocks may represent areas where institutional orders were executed and where market participants could show renewed interest if price returns.
Traders often use order blocks to identify:
Potential support and resistance.
Trade entry opportunities.
Risk management levels.
Fair Value Gaps (FVGs)
A Fair Value Gap occurs when price moves aggressively, leaving an imbalance between buyers and sellers.
Characteristics
Rapid displacement in price.
Limited trading activity within the gap.
Potential retracement opportunities.
SMC Perspective
Many traders monitor FVGs because markets frequently revisit imbalanced areas before continuing their broader trend. These zones can provide valuable confluence when aligned with market structure and liquidity.
5. Volume Analysis: Confirming Price Action
Volume serves as an important confirmation tool for traders applying Smart Money Concepts.
High Volume
High volume often suggests:
Strong market participation.
Increased conviction behind a move.
Greater likelihood of trend continuation.
Low Volume
Low volume may indicate:
Weak participation.
Lack of conviction.
Increased risk of false breakouts.
Best Practice
Price action should never be analyzed in isolation. Combining candlestick structure, market context, liquidity, volume, and market structure provides a more comprehensive view of market behavior.
Final Thoughts
Candlestick charts provide the foundation for understanding market behavior, while Smart Money Concepts offer a framework for interpreting the actions of larger market participants.
Successful traders focus not on individual candle patterns alone, but on how those patterns interact with:
Market Structure
Liquidity
Supply and Demand
Order Blocks
Fair Value Gaps
Volume
By integrating these concepts, traders can develop a more disciplined and objective approach to market analysis across forex, equities, commodities, cryptocurrencies, and the Nepal Stock Exchange (NEPSE).
Market.Nerds is committed to providing research-driven educational content designed to help traders and investors make informed decisions in today's evolving financial markets.